
Kinson Tsui Alcatel- lucent Integration Associate
Computer Programmer & Network Engineer
Senior Design: Distracted Driver Detector
This project is a continuation of last semester’s driver behavior recognition project, which used a Kinect (from Microsoft) sensor and its infrared and RGB camera components to keep track of the driver’ motion.
However, there came a time of realization that the Kinect also has its limitations and drawbacks. For example, sophisticated noise control measures were needed to maintain an acceptable level of accuracy, which our team wasn’t able to complete. The most important issue of all, however, is the fact that the Kinect is a specialty equipment originally developed for Microsoft’s XBOX 360 gaming console and might not be accessible to everyone. With these imperfections, we started to wonder if there are alternative solutions to our user behavior tracking system.
Finally, we’ve settled our minds on the Seeing Machine API, which consists of libraries that enables the tracking of head position and orientation of the subject with most webcams under the Microsoft Windows environment. Though the technologies behind the head tracking is undisclosed as it’s not open sourced, it does the job of tracking the user perfectly and is well suited for the starting point of our project. We will use the API as the foundation of our project and build upon it functionalities such as calibration, visual user alerts, data visualization, all in an interactive user interface.
User Interface
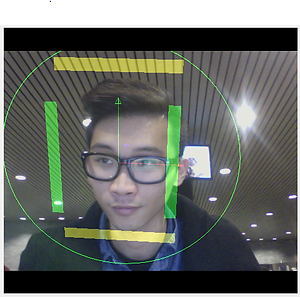
The program's window is composed of a video stream, text field for the duration of the calibration, the calibration push button and three displayed graphs to show pitch, yaw, and roll modes with the raw and calibrated data values displayed in the adjacent text fields.


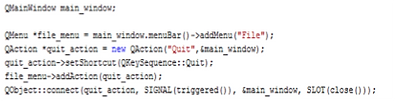
On the menu bar, there are two options: File and View. First, when we add the File tab at the menu bar on the main window, we use QMenu to initialize it as *file_menu. Then using QAction we create the option to close the window which is initialized as *quit_action and set it as the string value Quit. Once we finished initializing all the components we declare the action “quit_action as the pointer of *file_menu. After which we make the connection between the signal and slot. This connection enables the communication between the signal and object of quit action.
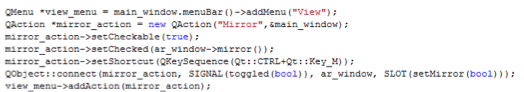
When it comes to the View tab, we also use QMenu to add View on the menu bar and initialize it as *view_menu. After that, we use QAction to initiate the option to create a mirror image of the cameras captured image which is initialized as *mirror_action. The use of *mirror_action is to create a boolean checkbox so that the program can read the users options on whether to display either a regular view or mirror view. To handle the mirror view, we declare it is true by default using mirror() function. Also, we simply make a shortcut for user to select mirror view by simply pressing Ctrl+M. Lastly, we make the connection between the signal and object of mirror action.
Layout Elements
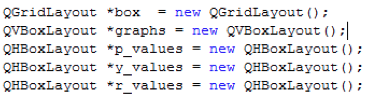
For the layout of our user interface, we used QGridLayout, QVBoxLayout and QHBoxLayout. First we decide to use QGridLayout because it is easy to organize all the widgets in a specific area of the window since it takes the spaces and divides it up into rows and columns grids, which then is a simple matter of choosing which widget to insert into the desired cell space. We initialize QGridLayout as *box for the future use since it's the main windows layout. Since we want to show the graph of pitch, yaw, and roll in a vertical view, we used QVBoxLayout and initializes it as *graphs to show all the graph and their values vertically. Moreover, we also want to show the selection of pitch, yaw, and roll. We used QHBoxLayout and initializes it as *p_value, *y_value and *r_value to show all the raw data and calibrated data in horizontal layout.

For QGridLayout *box, we assign a new widget to store the ar_window by setting it at the location of (0,0,3,1), which means we are putting the widget at the first row, first column and it spans for three row and one column. Also, we are adding another QHBoxLayout that contains user_cal and cal_button next to the ar_window element.
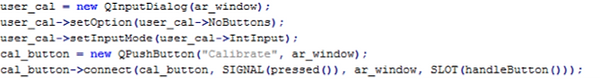
For user to input the duration time of the calibration, the value is taken from the text field and using a QInputDialog box displaying the duration value. The only values taken are integers in seconds. When the QPushButton is pressed, calibration starts and is handled by the handleButton() function which will be explained later

In a QHBoxLayout, we also want to show the label of the individual rotations. For instance, raw data, calibration data, pitch data, yaw data and roll data. Label variables are declared as QLabels called *pitch_label_raw, *pitchlabel_cal, *yaw_label_raw, *yaw_label_cal, *roll_label_raw and *roll_label_cal respectively. On the other hand, we also assign text field for the raw time called edit_yaw, edit_pitch and edit_roll and initialize them as 0. As we show the raw data, we also want to display the calibration data as we assign text fields for calibrated value cal_yaw, cal_pitch and cal_roll and initialize them as 0, which is the same operation as the raw data that we mentioned before.

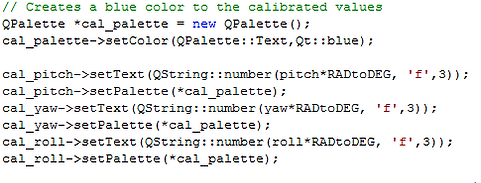
We want to show the differences between the raw and calibrated data. By initializing *raw_palette, *cal_palette using QPalette, it enables us to change colors using setColor() function. As a result, the text field of the raw data of roll, pitch and yaw will be in red and blue and calibration data will be blue.
The QHBoxLayout is then inserted into the QVBoxLayout before the respective graphs in the order of pitch, yaw, and roll.

Calibration
Calibrating the new roll, pitch, yaw values meant understanding what the current roll, pitch, yaw values are. They were obtained from an already given formula which took the x-, y-, z- axis coordinates and calculated the angle between two vectors.
The roll is calculated as being the angle between the yaw and pitch angle and is calculated last. The pitch is calculated as the angle between the y-axis and its projection on the x-z plane, this is calculated first. Then yaw is calculated after the pitch as the angle between that projection and the z-axis.
Now that we have roll, pitch, yaw values to work with we can start introducing the calibration method used. Firstly, we used the median calibration method in order to sort the values faster. We created three arrays to hold the roll, pitch, yaw values output during a short amount of time, known as the calibration time, which is chosen by the user. The maximum value a user can choose to calibrate is 30 seconds, which is set by allowing the arrays to only store 30 seconds worth of frames and is equivalent to 300 frames.
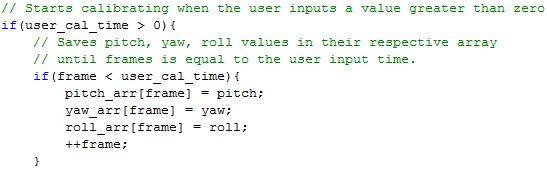
Now once the user input a calibration time value greater than 0 the calibration starts. The calibration is controlled with 3 if statements that takes in the frames that have passed and compares it to the frames the user input. The user input is in seconds and the frames is calculated by multiplying that input by 30. The first if statement starts once the frames are less than the user input, which is 0 when the user presses the calibration button.

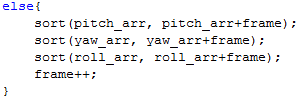
When we are in this statement the outputting roll, pitch, yaw values are stored into the roll, pitch, yaw array, respectively. Each time the values are inserted into the array the frames value also increases until the value is equal to the user's calibration time. Once the frames are equal to the user's calibration time the values in each array are sorted and the frames is increased once more. This is when the last if statement is initiated and the median value is calculated for each array. We take this value and subtract them from the real time roll, pitch, yaw values and store them in new variables; cal_roll, cal_pitch, and cal_yaw in order to output these new calibrated values in their own labels.
Plotting Raw and Calibrated Data
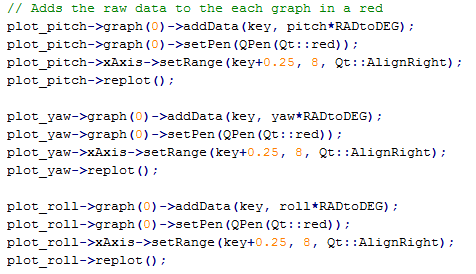
Using the QCustomPlot library, real time roll, pitch, and yaw values are each plotted in a QCustomPlot graph declared as *plot_roll, *plot_pitch, and *plot_yaw and are drawn in a red colored line using the setPen() function. The setPen() function is a function of the graph() function. The graph function had many functions that handle the appearance of the graphs, from the amount of data displayed to the style and color of the line representing the values of the data. Each value is plotted in its respective graph by adding the data to the graph and calling the replot() function when a new value is outputted.
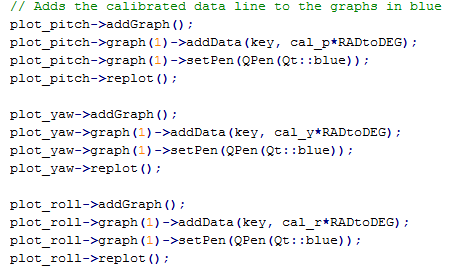
The calibrated roll, pitch, yaw values are plotted in the same graphs the real time values were plotted in but only when the user initiates a calibrated value time. Specifically in the last if statement when the values are already outputting the new calibrated values. The calibrated value line is then drawn with the same setPen() function but in a blue color to display the difference in values.
Draw Axes
The drawAxes() function is responsible for superimposing axes that corresponds to the X,Y and Z dimension onto the video stream window, and their colors are Red, Green and Blue respectively. As one can see from the screenshots above, the Z - Axis is therefore pointed towards the back of the subject’s head, Y-Axis towards the top of the head and X- Axis the side of the head. This structure adheres to the left - hand rule system to better assert the view’s position, as the viewer’s sight correspond to the Z-axis pointing into the viewing device (monitor) and toward the back of the subject’s head.
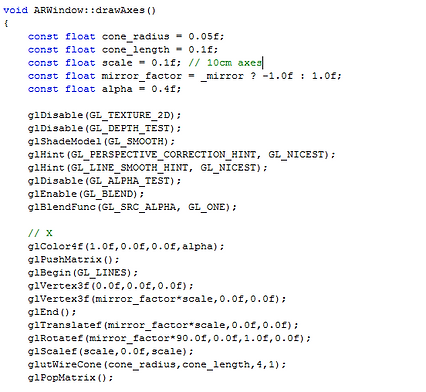
The drawAxes() function starts with some constant variables used in the drawing process. Most of these variables are self explanatory, but mirror_factor might need some clarification: It is a variable that, depends on its value, the final drawing of the axes could be facing toward the user, when mirror_factor is -1.0f, or away from the user, when the mirror-factor is 1.0. The value of mirro_factor is determined during the initialization process of the ARWindow, where it decides whether the video stream should display a mirrored image or not.
Then comes the part where OpenGL housekeeping functions are called to establish a foundation for the user to start drawing. For example, since there’s no texture mapping nor depth information involved while drawing the axes, both GL_TEXTURE_2D and GL_DEPTH_TEST are disabled. The following GL functions are of the similar nature, such as defining the shader model and what types of blending functions to use.
The next section is where the actual drawing of the axes happens. First we define the color of the axes (X-axis in this screenshot) to be Red, therefore the function call is glColor4f (1.0f, 0.0f, 0.0f, alpha) to select the color red on the RGB scale, while alpha is the transparency argument and is defined as 0.4f. A new matrix is being pushed at this point for the transformations that are about to be performed on the axis, which is assembled by specifying the two end point for the axis. The now drawn axis will then rotate and scale in correlation with the position and orientation of the user, while keeping its origins at the center of the user’s head. Finally, a wire cone is drawn at the farthest reach of the axis to indicate the vectorial direction of the axis. The drawing process is very similar for the other 2 axes, with the only differences being the position of the second point is defined differently.
Draw Warning Bars (Sidebar and Circles)
The fundamental functionalities of Draw Warning Bars are to display graphical elements that corresponds to the degree of rotations (of the user) around the X,Y and Z axes, which are conventionally referred to as Pitch, Yaw and Roll respectively. For this implementation, we’ve decided that there’d be three levels of movements: Low, Medium and High. These different levels of movements are each bounded by predefined threshold values and represented by different colors, shown below:
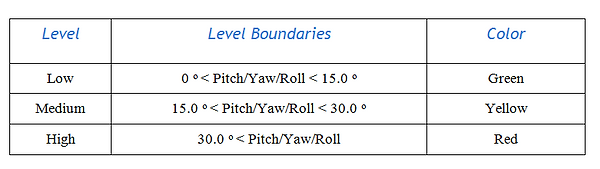
In addition, the table below shows the graphical elements that corresponds to a specific rotations:
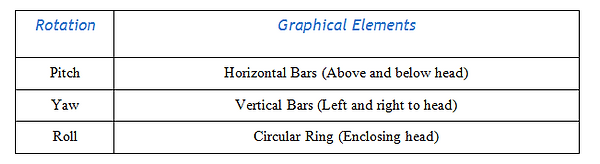
The Draw Warning Bar, in actuality, consists of 3 components, which will be discussed in detail:
-
set[Rotation]Alerts(rotation): Receiving the rotation data and setting the corresponding color level
a) Raw Data
b) Calibrated Data (Requires adjustment to Threshold)
-
get[Rotation]Alerts(): Returning the color information
-
drawBars(): Actual drawing of the graphics

The functions responsible for setting the colors are setPitchAlert(double pitch), setYawAlert(double Yaw) and setRollAlert(double roll), the arguments are the rotations corresponding to the function name. These arguments represent the raw data that gets passed into the functions whenever a new frame is being created, thus the graphical elements can reflect changes in real time. Essentially, the functions take in the data from the current frame, determines the level of rotation and assigns the appropriate color to set the color to. The variable that stores the current frame color information are pColor, yColor and rColor for pitch, yaw and roll respectively.

The getPitchAlert(), get YawAlert() and getRollAlert() functions will then return these variables to the calling location, which is, approximately, in the drawBars() function as its the function where the actual drawing happens and needs to access the color information.
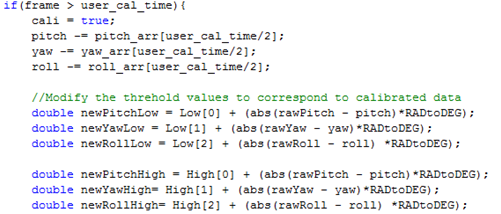
Before we take a detailed look at the drawBars() function, however, we need to now tackle the issues brought about when the user decides to use the calibration function. Namely, we need to adjust the graphics accordingly to reflect the newly provided dataset. Above figure shows the calculation needed to reflect the difference between the raw data and the calibrated one. In essence, since our calibration method creates an offset between the raw and calibrated dataset, we need to just add this offset to the predefined threshold values. And we store the sum of the addition to new variable names such as newPitchHigh and newPitchLow, to represent the new boundary values for the Pitch threshold.

Additionally, the color setting functions need to be modified accordingly. They now requires three function arguments, which are the calibrated rotation value and the newly defined corresponding boundaries. These arguments will be used in the same way the equivalent variables did in the Raw data version of the color setting functions.
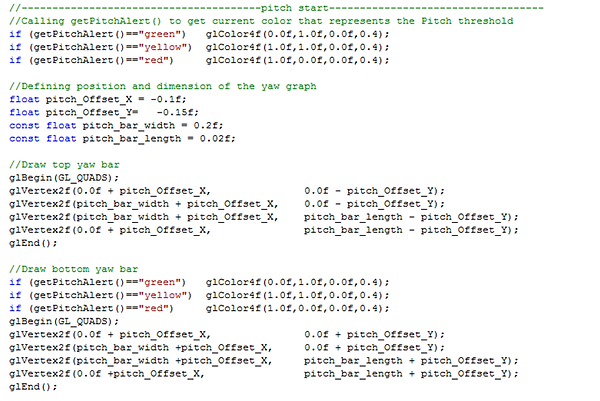
Shown above is the “meat” of the drawBars functions, which draws the vertical bars, horizontal bars and circular ring with colors that reflect the user’s level of rotation. We start by calling the get[Rotation]Alert() functions to define the glColor to draw the graphics. Then, for the Pitch and Yaw components (Both are bar type graphics aligning on different axes), we define the dimension and position of the GL_QUADS that we are using to draw.
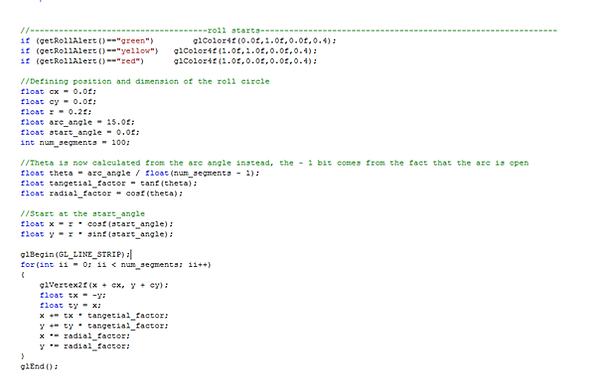
As for the roll component, we first define the center,radius and thickness of the circle, getting the appropriate color, then we use the GL_LINE_STRIP to draw the circular ring.
Draw Mask
I'm a paragraph. Click here to add your own text and edit me. I’m a great place for you to tell a story and let your users know a little more about you.

As an experimental feature, we’ve added the functionality to superimpose a 3D object (in this case the outline of a monkey’s head) onto the video stream the same way the axes and graphical elements does. Since the details in building this feature goes beyond the scope of, and slightly unrelated to, this project, which focuses on the monitoring of driver’s behavior, the discussion on this section will be brief.
In this implementation, we are drawing 3D objects with the OBJ file, a 3D object file extension associated with software such as the open - sourced 3D modeling tool. Note that one hard requirement, in order for the OpenGL to draw OBJ file, is that these files has to be first tessellated (triangulated) before we load it into the system. To start, we need to read and parse the OBJ files and store information extracted into individual arrays. These information includes vertex positions, vertex normals, faces… etc. After parsing, which has proven itself to be much more difficult than the drawing part, we then simply tell OpenGL to draw the array elements with the appropriate OpenGL primitive shapes.
Challenges and Possible Improvements
Throughout this semester, we have spent a considerable amount of time to understand the structure of the program since the source files TestAppGL and ARWindow are intertwined in terms of data usage. And although we had been using QT signals and layouts previously in the Kinect based project, its usage and methods remains confusing at times. The most challenging aspect of the project, in the groups’ point of view, is to build the calibration process, which requires a lot of care and attention to maintain data correctness. Also, we had decided to draw a 3D model on top of the ARWindow, with most of the difficulty comes from the parsing of the OBJ file.
As we go deeply into learning the FaceTrackingAPI and developing the software, we dreamt up some possible improvements to the project for the near future. For the technical side of things, we can add the functionality to record the image stream as a video while keeping track of the frames that had the rotational component being marked “Red”. This will give us the ability to go to these “Violation” frames in the videos to investigate the reason behind the violations. In addition, we can use a better storage method for data handling. For example using the dynamic array instead of linear array will limits the memory usage of the program, which could potentially crash because of memory issues. As for the functionalities improvement, we had visions of developing an equivalent application on the mobile platform (Android, IOS) which include alert actions such as sound and vision alert.
Conclusion
In summary, we’ve met our goals of building a driver distraction detection program with useful functionalities built upon the use of FaceTrackingAPI. Namely, we’ve successfully implemented a calibration system that allows user input of calibration duration, plotting the raw and calibrated data using QCustomPlot, displaying real time graphics that notifies user of their distraction level and the experimental feature of displaying 3D object in real time. We understand that it might not be a perfect product and have ample rooms for technical and functional improvements, but our team mutually thinks it’s been a very productive and meaningful learning experience.